HAGER process stressor data management
2. Collect stress data types quantitative metrics qualitative inputs
Reduce stressor by feeding the AI Model with data quality determine the result quality of your enquiry
Combining Structured + Unstructured Data from different data silos / data resources ( email, sharpoint, CRM customer relationship management )
the knowledge hub data base has curated data from raw material from different data silos / data resources
Example: user 1 asks Healthcare Chatbot to get confidential customized chatbot – voice answer based on knowledge hub data base, user 2 asks Healthcare Chatbot gets confidential customized chatbot – email answer based on knowledge hub data base
Quantitative Metrics via IT
- Cycle time / lead time (especially spikes or delays)
- Error rates / defect rates
- Task retries / rework levels
- Utilization rates (e.g., human or machine capacity)
- Downtime / system lags
Qualitative Inputs via SWISS HAGER
- Employee surveys (e.g., using Likert scales to assess stress)
- Interviews or focus groups
- Observation notes
- Customer feedback (indirect indicator of stress impact)
- Metadata allows to search via filters like author
- Structured data: patient vitals, diagnosis codes
- Unstructured data: doctor’s notes, patient conversations
- Generation: personalized explanations, summaries, discharge instruction
Process Mining tool to collect data
Process mining can be used to collect and analyze different types of stress-related data by uncovering patterns in event logs that reflect user behavior, system usage, and workflow dynamics. While process mining itself doesn’t directly measure stress (like cortisol levels), it can infer or correlate stress indicators from behavioral patterns and system interactions.
Example 🏥 Healthcare Data Transformation Example
📥 Step 1: Collect Raw Data
- Sources: Vital monitors, lab machines, hospital ERP systems
- Raw data:
- Heart rate:
HR=135,HR=90 - Blood sugar:
GLU=260mg/dL - Lab result:
POSITIVE,NEGATIVE
- Heart rate:
🧹 Step 2: Clean the Data
- Remove incorrect or corrupt entries
- Handle missing values
- Standardize formats (e.g., all timestamps in ISO 8601)
🧱 Step 3: Structure the Data
Organize into tables or records like:
| Patient ID | Timestamp | Heart Rate | Blood Sugar | Lab Result |
|---|---|---|---|---|
| P001 | 2025-06-24T08:00:00Z | 135 | 260 | POSITIVE |
| P002 | 2025-06-24T08:01:00Z | 90 | 105 | NEGATIVE |
🏷️ Step 4: Enrich & Label
- Add context:
- Flag abnormal vitals (
HR > 120 → High HR) - Link to diagnosis codes (
ICD-10, etc.) - Tag lab results with metadata (e.g., lab type, confidence score)
- Flag abnormal vitals (
📊 Step 5: Curate & Present
- Store in a secure database
- Use in dashboards, patient reports, ML models, or alert systems
- Ensure compliance with privacy regulations (e.g., HIPAA)
Here’s how process mining can help collect or infer different stress-related data types, along with relevant examples:
1. Behavioral Event Logs (Digital Behavior)
Type: System logs, activity logs, keystroke/mouse dynamics
Inferred Stress Indicator: Unusual interaction patterns, erratic or rapid clicks, frequent backtracking
Example Tools: Event logs from ERP, CRM, or web-based systems
Use in Process Mining:
- Detect deviations from usual task execution paths
- Identify bottlenecks and frequent rework cycles
- Cluster users with inefficient or error-prone behavior
- Higher click frequency or task repetition can indicate stress or confusion
2. Time-Based Metrics
Type: Duration logs, timestamped events, idle time
Inferred Stress Indicator: Long task durations, abrupt time gaps, excessive overtime
Example Tools: Workflow engines, ticketing systems, time-tracking software
Use in Process Mining:
- Visualize time spent on each process step
- Compare stressed vs. non-stressed user groups
- Identify steps causing delays or rushed completions
3. Error and Exception Logs
Type: System or process error reports
Inferred Stress Indicator: Increased error frequency may reflect cognitive overload or task complexity
Example Tools: Application logs, bug trackers, system diagnostics
Use in Process Mining:
- Identify process variants with high error rates
- Flag critical process paths with repeated exceptions
- Correlate error frequency with user activity patterns
4. Communication Patterns
Type: Email metadata, chat transcripts, meeting logs
Inferred Stress Indicator: Increased volume, response delays, terse language
Example Tools: Microsoft Exchange logs, Slack/Teams exports
Use in Process Mining:
- Visualize communication flows (e.g., stress during project deadlines)
- Analyze increased collaboration or communication breakdowns
5. Physiological Data (when integrated)
Type: Wearable data (heart rate, EDA, sleep)
Inferred Stress Indicator: Biometric stress signals
Example Tools: Smartwatches, biometric sensors (must be integrated with task logs)
Use in Process Mining:
- Correlate process steps with physiological stress markers
- Detect which tasks or users show physical stress responses
6. Self-reported or Survey Data (Supplementary)
Type: Questionnaires, stress scales, feedback forms
Inferred Stress Indicator: Subjective experience of stress
Example Tools: Google Forms, Qualtrics, internal surveys
Use in Process Mining:
- Enrich process variants with subjective stress indicators
- Identify correlations between stress levels and process steps
Practical Example
Imagine applying process mining to a customer support system:
- Agents‘ workflows are analyzed.
- Longer ticket resolution times + frequent escalations = process stress points.
- Combined with increased HR-reported burnout → supports changes in workflows or task distribution.
Summary Table
| Data Type | Source | Stress Indicator |
|---|---|---|
| Event Logs | ERP/CRM logs | Task rework, high click density |
| Time Logs | Workflow systems | Long duration, delay, multitasking |
| Error Logs | Application/system logs | High error/retry rates |
| Communication Logs | Email/chat metadata | Delay, frequency, sentiment |
| Physiological Signals | Wearables (e.g., Fitbit) | Heart rate variability, EDA spikes |
| Survey Data | Feedback forms | Self-reported stress |
3. data analyzing: Identify stress patterns in stress data types
Goal:
Use AI to detect stress patterns from:
- Quantitative data (e.g., sensor readings, app usage, biometric data)
- Qualitative data (e.g., surveys, text, voice notes)
Data Types
Quantitative Metrics via IT Systems
Collected passively or through sensors:
- Heart Rate Variability (HRV), Skin Conductance (EDA/GSR), Cortisol levels
- Sleep duration, steps, screen time, app usage logs
- Keyboard/mouse activity
- Timestamped physiological data (CSV, APIs, IoT)
Qualitative Inputs
Collected actively via:
- Stress diaries
- Self-reports (Likert scales, Perceived Stress Scale)
- Voice logs
- Open-ended survey text
Stress Pattern Analysis Framework
| Step | Action | Tools / AI Workloads |
|---|---|---|
| 1. Ingest | Collect and unify structured and unstructured data | Pandas, APIs, IoT pipelines |
| 2. Preprocess | Clean data, normalize metrics, parse text/audio | SciPy, spaCy, Librosa |
| 3. Feature Extraction | Time-series features (quant), sentiment/emotion (qual) | tsfresh, transformers, librosa |
| 4. Pattern Detection | Cluster/label patterns of high/low stress | KMeans, DBSCAN, LSTM |
| 5. Prediction/Insight | Train AI to predict stress levels or flags | XGBoost, RandomForest, BERT, Multimodal DL |
| 6. Visualization | Dashboard for time-trend stress monitoring | Plotly, Dash, PowerBI |
AI Workloads for Each Data Type
Quantitative (Time-Series / Biometric)
- LSTM / GRU: Time-based stress prediction
- Autoencoders: Anomaly detection in stress episodes
- XGBoost/RandomForest: Feature importance (e.g., HRV drop, EDA spike)
Qualitative (Text / Voice)
- BERT or DistilBERT: Emotion/Sentiment detection in text
- Wav2Vec2 + RNN: Stress emotion detection in voice
- Clustering: Themes from open-ended text (KMeans, LDA)
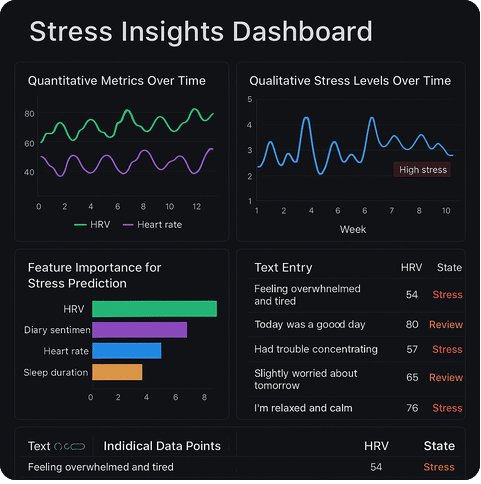
Sample: AI Workflow Summary
Example:
You collect:
- HRV (Quant)
- Weekly diary entries (Qual)
Workflow:
- Normalize HRV → extract mean, RMSSD, SDNN
- Analyze diary with emotion classifier (BERT)
- Label entries: High HRV drop + negative tone → „high stress“
- Train a classifier: Predict stress risk next week
- Output insights: HRV drop + sad diary = 80% stress likelihood
Klick here for Stress insight
More? Please check
1. Get HAGER whitepaper for your leaving your customer data here: https://markushager.com/en/contact/
2. Join the top HAGER subscribers here:
